Research
An attractive tested line can be a description of the past you already saw
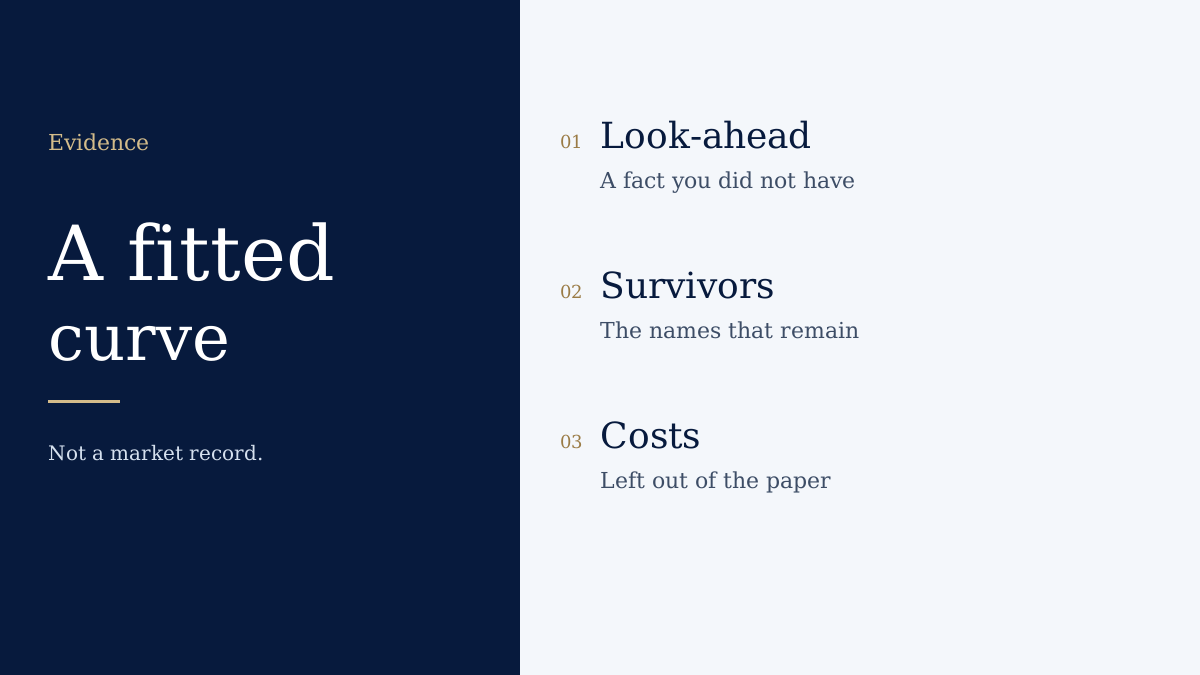
A test that uses information which was not available at the time, drops the names that failed, or tries many rules and keeps the winner, will draw a kinder line than the rule you could have traded. That line is not a forecast and it is not a track record.
Key points
- If the rule was chosen after seeing the path, the path is not an out-of-sample test.
- Costs, slippage and missing names belong in the test or the test is a different strategy.
- This site does not run a backtest and it does not plot a synthetic curve as if it were history.
What is going on
Look-ahead bias uses a price, a membership list, or a revised figure that traders did not have on the date of the signal. Survivorship keeps the companies or funds that still exist and forgets the ones that do not. Data snooping tries variations until one looks good. Overfitting is the same habit in the parameters: the lookback that best matches the sample. A later, untouched period is a stricter check, and it can still be a different regime. Transaction costs and impact turn many paper results over.
Why it matters
The honest sentence is narrow. A test supports a rule only for the universe, the costs, the window and the selection process that were actually used. Change any one and you have an untested variation. A smooth equity curve is easy to produce from a rule fitted to the same curve. Publishing it beside a strategy name does not make it evidence. WiT Markets will not add a fake engine to fill that gap.
What to watch
Ask when the rule was frozen, which names were excluded, what cost was charged, and what happened on a period that was not used to pick the parameter. If those answers are missing, the picture is incomplete. Prefer that to a precise percentage.
Risks
Even a careful test is about the past. A rule can be sound on its own terms and still lose money next. This note does not certify any published track record.
What this site will not draw
There is no historical market feed behind the strategy hub and no generator of a pretend equity curve. Illustrations elsewhere on the page are labelled as structure or as arithmetic you can recompute from inputs. They are not performance.
Related
Sources and review
Written by: WiT Markets Editorial. Writes and structures WiT Markets pages. Separates a sourced fact from a cell that is Not confirmed.
Review: Editorially reviewed. This is not a qualified specialist review and it is not a legal sign-off.
Last reviewed: . Next review due . The date is an editorial pass. It is not a live check of every third-party fee.
Regulatory and official sources
- Investor.gov — checked 13 October 2026
Other sources
- WiT Markets methodology — checked 13 October 2026
Methodology. Editorial policy. Corrections. Report an error.