Investment and trading strategy research
Investment & Trading Strategies
Understand the rules, assumptions, risks and trade-offs behind different approaches.
Independent research on long-term investing, allocation, rebalancing, position size, trend rules, options structures and hedges. A strategy is a set of decisions you can review. It is not a promise of a return.
- 1Objective
- 2Universe
- 3Rule
- 4Size
- 5Cost
- 6Retire when
Featured research
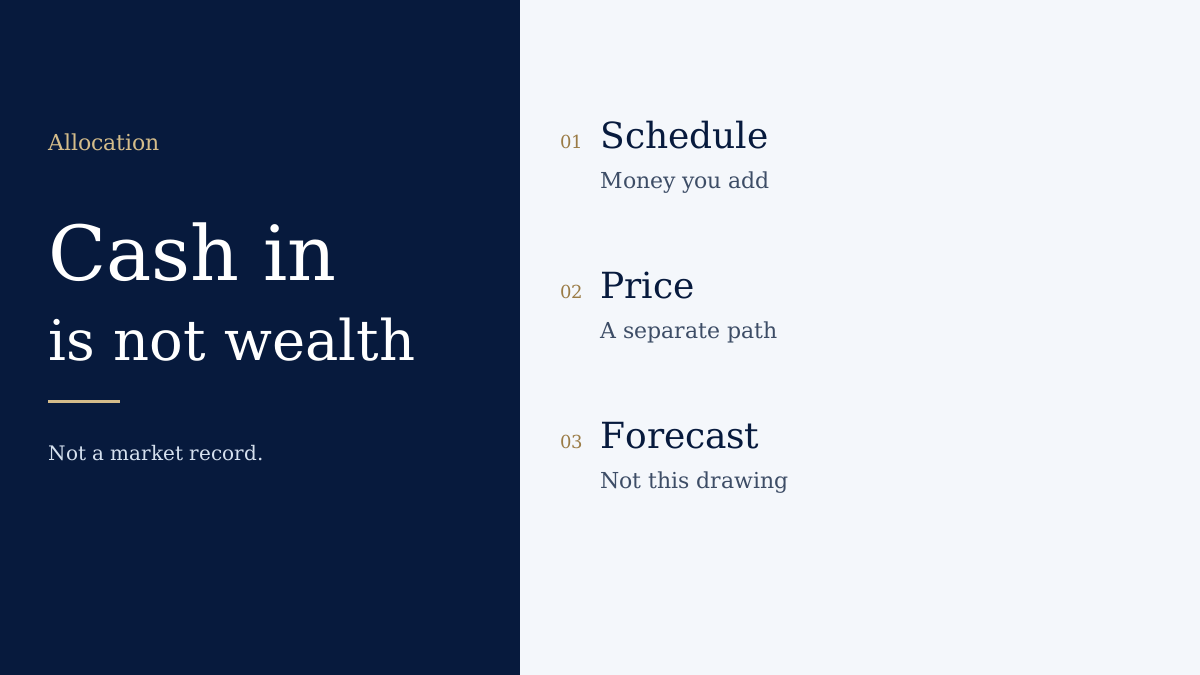
Long-term rules
A contribution plan is a rule, not a forecast
What buy-and-hold, diversification, dollar-cost averaging and dividend reinvestment assume, and what they do not promise.
Read analysis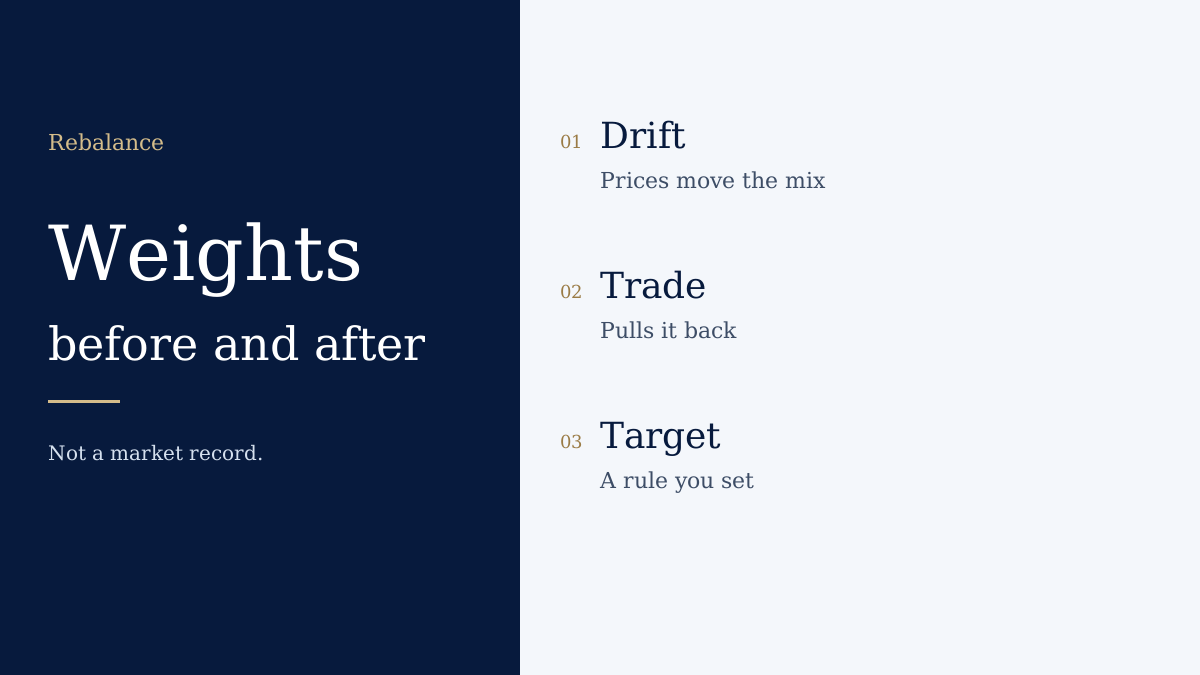
Rebalancing changes weights. It does not time the market
How a rebalancing rule, a risk budget and a hedge differ, and why a worked options or futures example is not a track record.
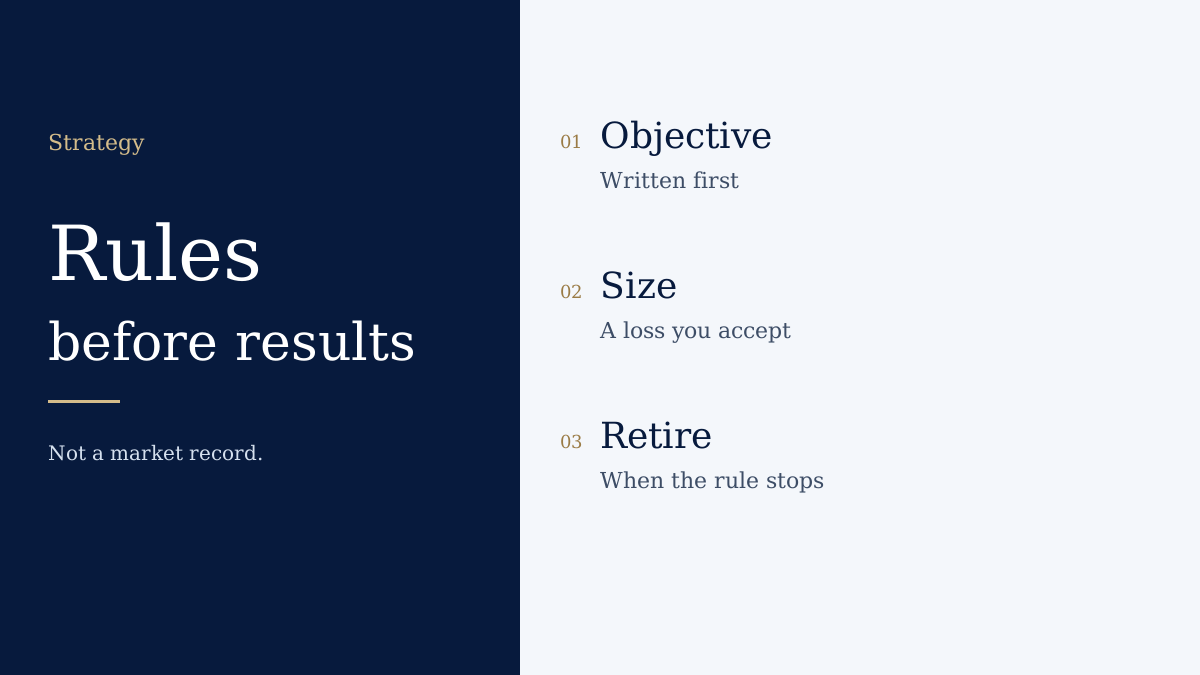
A strategy is a set of rules, not a promise of a result
What to write down before treating an investment or trading approach as something you can review: objective, universe, sizing, costs and the conditions that would retire the rule.
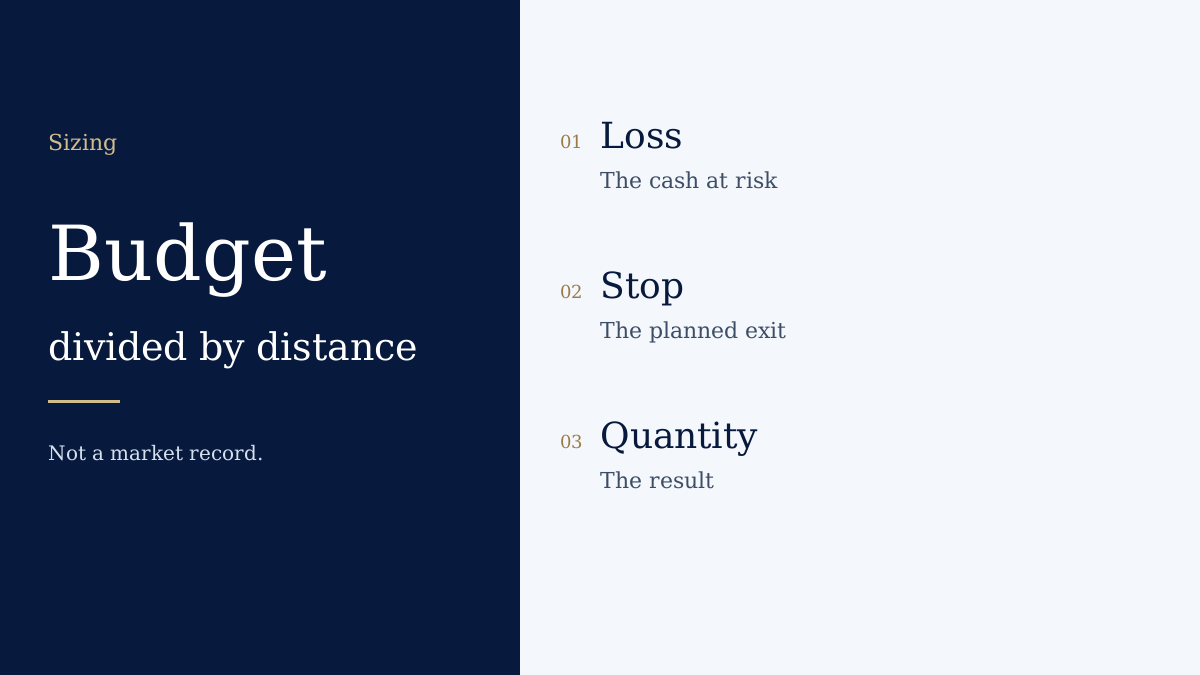
Position size follows the loss you are willing to take
How a fixed fraction of capital, a stop distance, and a volatility estimate become a quantity, and why each one fails when the exit is worse than the worksheet.
Strategy categories
Eight questions. Counts are published notes carrying that tag. A note can carry more than one tag. The count is not a score.
Long-term investing
Buy and hold, a schedule of contributions, and dividends as a separate assumption from the price.
Objective. Follow a funding and holding rule you can review.
Limitation. A schedule does not stop a long decline, and it does not beat a lump sum on every path.
2 published notes
Explore researchAllocation and rebalancing
Target weights, a calendar, a band, and new cash that buys the light holding without a sale.
Objective. Pull weights toward targets you set earlier.
Limitation. Trading back to target does not identify the next winner, and it has a cost.
3 published notes
Explore researchPosition size and risk
A loss budget, a stop distance, and a volatility estimate are three ways to write a quantity.
Objective. Make a wrong exit cost a loss you already accepted.
Limitation. The worksheet is not the loss if the exit is worse, or if several positions fail together.
1 published note
Explore research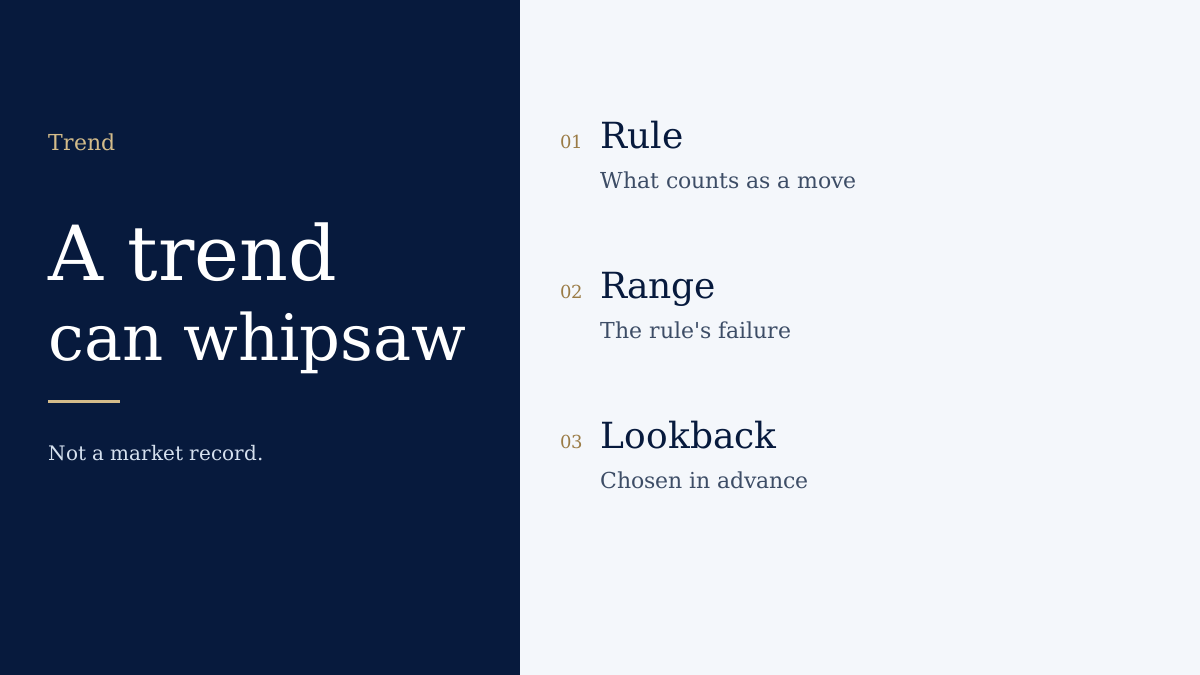
Trend and momentum
Filters and rankings that take exposure after a move has been measured.
Objective. Stay with a move the rule has already defined.
Limitation. A range produces whipsaws. A lookback chosen after the path is not a test.
3 published notes
Explore research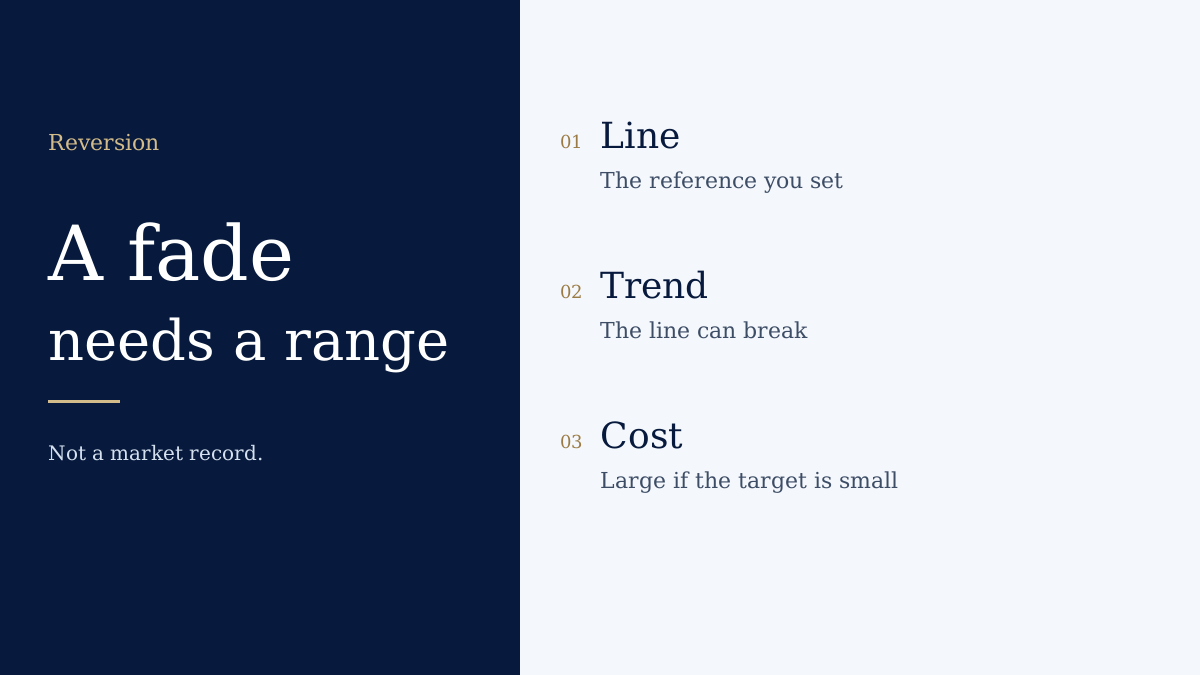
Mean reversion
Entries that fade a move back toward a reference, often for a small distance.
Objective. Trade the return to a line you defined.
Limitation. The line can be the thing that changed. Costs are large when the target is small.
1 published note
Explore research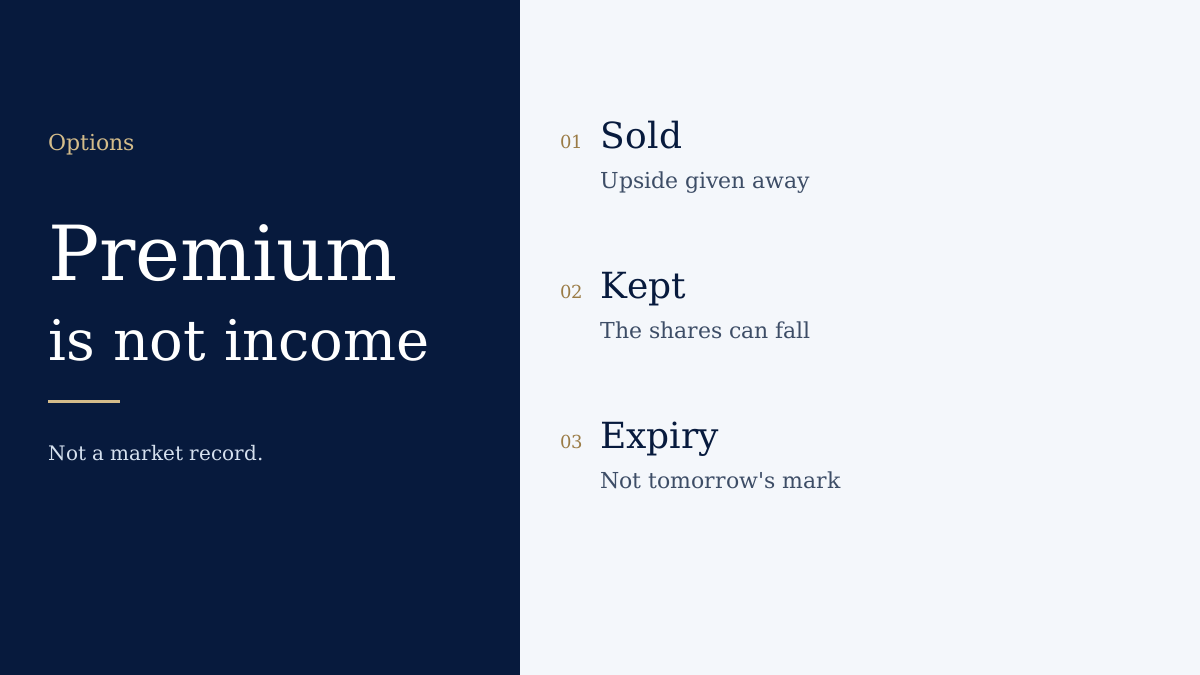
Options structures
Covered calls, protective puts, collars and spreads as expiry shapes, plus what the shape leaves out.
Objective. Exchange a payoff for a premium.
Limitation. Premium is not free income. An expiry drawing is not tomorrow’s price.
2 published notes
Explore research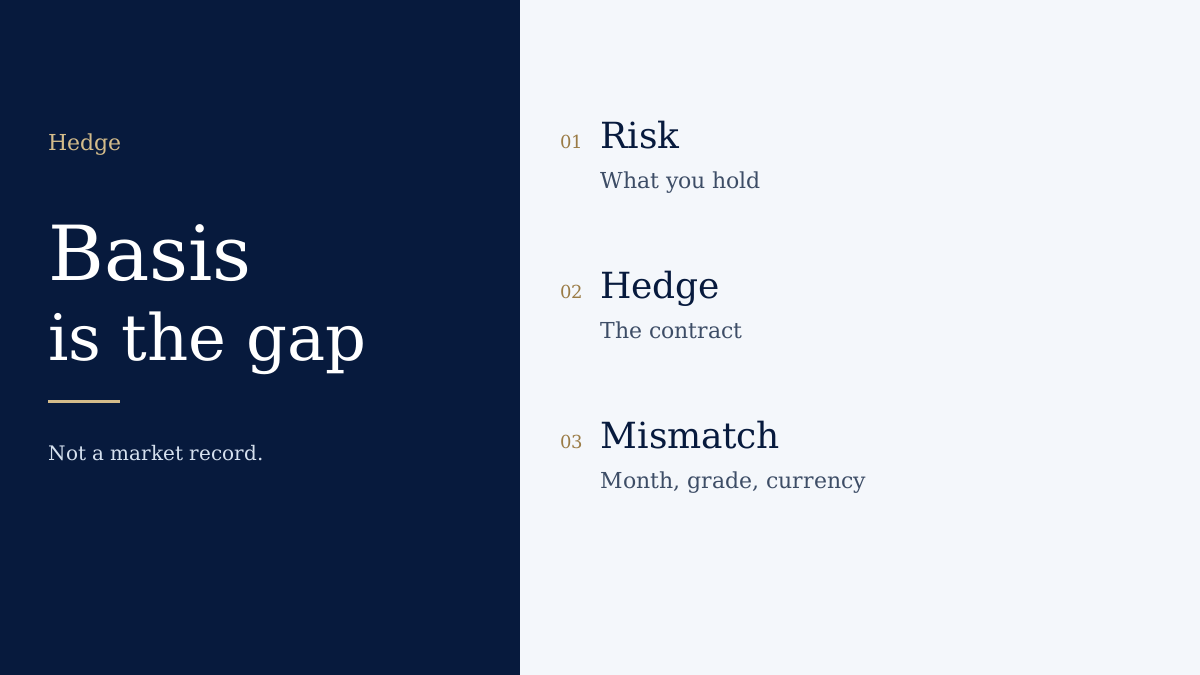
Hedges
A contract used to offset an exposure, with basis, size and collateral written beside it.
Objective. Transfer a named risk to a named contract.
Limitation. A different month, grade or currency is a different risk. Collateral can force a reduction.
2 published notes
Explore research
Diversification
Weights, a risk budget, and the estimate of how holdings move together.
Objective. Decide which risk is allowed to dominate.
Limitation. Correlation is a window. Diversification does not remove losses.
1 published note
Explore researchCompare approaches
Dollar-cost averaging and a lump sum differ in when cash becomes exposure. A calendar and a band differ in when you trade. The lab extends that kind of comparison. It does not produce a probability of success.
Up to three approaches. The rows describe structure. They are not a ranking and they are not a return.
| Question | Dollar-cost averaging | Buy and hold |
|---|---|---|
| Objective | Turn arriving cash into exposure on a schedule. | Keep a chosen exposure through declines unless the written rule says otherwise. |
| Rules | Invest a similar amount on dates you choose. The unit count changes with the price. | Define the holding and the condition that would make you sell. Do not add a forecast. |
| Instruments | Anything you can buy in slices. Cash that is waiting is not yet exposed. | Shares, funds, or other holdings you can actually keep. |
| Horizon | The length of the schedule, then whatever holding rule follows. | Longer than a single news cycle. You set the review date. |
| Activity | One ticket per date. | Low, until the review or the failure condition. |
| Costs | A cost on every ticket, plus any fee on cash that has not been invested. | The spread and any commission at entry, plus ongoing fund or account charges. |
| Assumptions | The schedule is funded. A steadily rising path favours investing earlier. | You can fund the holding and tolerate a long drawdown. |
| Risks | A falling path hurts the amounts already invested. The schedule does not stop that. | A long decline. Concentration if one holding becomes the account. |
| What can break it | Treating one assumed rate as proof the schedule beat a lump sum. | A path that falls for longer than the patience you wrote down. |
| Research | A schedule is not a lump sum | A contribution plan is a rule |
| Calculator | Dollar-cost averaging calculator | Compound growth calculator |
Long-term rules
A contribution is a funding decision. Rebalancing is a weight decision. A dividend is a company decision that may not be repeated. Inflation changes what a nominal balance can buy, and it is not a line in the contribution calculator unless you put it in the rate you assume.
The calculators illustrate a return you type, after a fee you type. Change the assumption and you are looking at a different picture.
Contribution plan · Schedule versus lump sum · Dollar-cost calculator
Active rules
Trend, momentum, breakout and mean reversion are definitions of what recent prices mean. The entry you draw is not the fill. A spread, a gap and a thin book sit between the signal and the position. A stop is an instruction with its own failure mode.
Portfolio construction
Weights, a volatility estimate and a correlation window are descriptions of a sample. Several funds can share the same large holdings. Currency can dominate a foreign weight that looked small in the home currency. Liquidity and counterparty risk do not appear in a returns correlation.
Options and hedges
A covered call sells upside. A protective put buys a floor and charges a premium. A collar does both. A futures hedge transfers risk only as far as the contract matches the exposure. Expiry drawings are not marks before expiry. This page does not reprint a contract multiplier.
How a rule changes the outcome you are looking at
Each pair is a difference of structure. The numbers, when you want them, are typed into the calculator named under the pair. Nothing here is a historical result.
A fixed cash loss does not shrink when the account does.
A percentage shrinks or grows with the capital you type.
Both are loss budgets. Neither is the loss you get if the exit is worse than the stop. The position-size calculator uses the budget, the distance and the multiplier you enter.
How to read a strategy before trusting it
Objective
What disappointment still counts as the rule having been followed?
Why it might fit
What exposure does the rule actually create? A story about the economy is not that exposure.
Evidence
Which universe, window and cost were in the test? If the rule was chosen after the path, the path is not a fresh test.
Cost
Spread, tickets, financing and the number of turns. A cost inside the fill is not added again.
Regime
Name the market that makes the assumption fail: a range for a trend rule, a trend for a fade.
Practice
Can you trade the size at a price near the one in the worksheet? A signal on a chart is not a fill.
Why a tested line can mislead
Look-ahead bias uses a fact the trader did not have. Survivorship drops names that failed. Trying many rules and keeping the winner describes the search, not the next path. Ignored costs turn a paper result into a different strategy. A later period is a stricter check, and it can still be a different regime.
This site does not run a backtest and it does not draw a synthetic equity curve as if it were history.
Build a rulebook
Write the objective, the market, the horizon, the entry, the exit, the risk limit, the costs, the review and the condition that retires the rule. Copy it, print it, or download a text file. Clearing the form removes it from this page.
Published notes
Search matches the title and the summary. Filters use the tags on published notes. A blank result is left blank.
Investment & Trading StrategiesTrading rules
A breakout level is a price on a chart, not a guaranteed fill
How a breakout entry, a false break, and a stop beyond the range depend on liquidity at the moment the level is touched.
- A stop or a stop-limit does not promise the price printed on the chart.
- A false break returns inside the range and often pays the spread twice.
- Size the loss from a worse exit than the line you drew.
Investment & Trading StrategiesAllocation
A calendar and a band are different instructions to trade
How calendar rebalancing, a threshold band, and new contributions that do the buying without sales change turnover, drift and cost.
- A date rule and a width rule trade at different times, so they incur costs on different paths.
- Letting contributions fill the underweight holding avoids a sale until the band is still breached.
- The rebalancing calculator uses weights you type. It does not predict the next winner.
Investment & Trading StrategiesAllocation
A contribution schedule and a lump sum take risk at different times
How funding timing, cash that is not yet invested, and the path of prices change the comparison between regular contributions and investing available cash at the start.
- The schedule changes timing. It does not, by arithmetic, beat a lump sum on a steadily rising path.
- Cash that is still waiting is not exposed, and it is also not earning the market return you might type into a calculator.
- Use the dollar-cost calculator with a return you assume. The label on the result is hypothetical.
Investment & Trading StrategiesDerivatives
A covered call is a sale of upside, not free income
What a covered call changes about a share you already hold: a premium received, a cap on the gain, and the shares’ downside still in the account.
- The premium is received because the upside is sold.
- Below the strike, the shares drive the loss. The premium only offsets a slice of it.
- The payoff calculator draws the result at expiry from inputs you type. It is not the value of the contract tomorrow.
Investment & Trading StrategiesDerivatives
A hedge can miss because the contract is not the exposure
Why contract size, a different underlying, a calendar spread between months, and collateral can leave a hedge imperfect. No exchange specification is reprinted here.
- The hedge ratio is a size you choose. It is not a promise the prices will match.
- A different month, grade, or currency is a different risk.
- Collateral can force a reduction before the hedge has done its job. The amount is on the contract and the firm, not on this page.
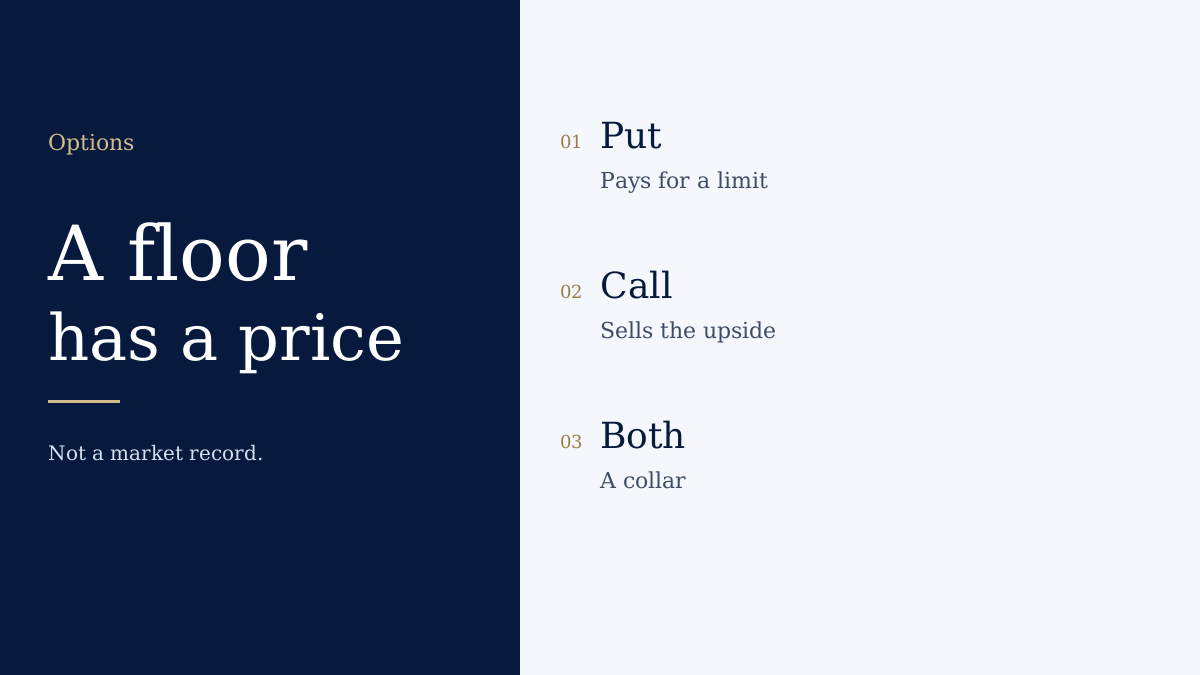
Investment & Trading StrategiesDerivatives
A protective put and a collar buy a floor and charge for it
How a long put under shares sets a floor in exchange for a premium, and how selling a call to fund that premium also caps the upside.
- The floor is only as good as the strike, the expiry and the fill.
- Funding the put by selling a call adds a cap.
- A debit spread and a credit spread cap the gain and the loss in different directions. Neither is automatically limited in every account if the contract is not the one you think.
Calculators
Each tool starts from numbers you type. A hypothetical balance is labelled as one. None of them looks up a historical strategy result.
Dollar-cost averaging
A schedule and a rate you assume.
OpenCompound growth
A hypothetical balance from inputs you type.
OpenDividends
A distribution you enter. It is not owed.
OpenInvestment fee
An annual charge against a return you assume.
OpenAllocation
Weights of holdings you enter.
OpenRebalancing
The gap between weights and targets you type.
OpenDrawdown and recovery
The gain required to return to a peak you type.
OpenPosition size
Quantity from a loss, a stop and a multiplier you enter.
OpenRisk and reward
A ratio from prices you type. Not a probability.
OpenStop and target
Distances you choose.
OpenProfit and loss
A result from prices you type.
OpenOptions payoff
The expiry shape of a structure you specify.
OpenFutures margin
Collateral from a contract size you type.
OpenForex position
A quantity from inputs you type.
OpenTrading journal
A record you keep.
OpenTrading performance
Figures from the journal.
OpenWhere the same question continues
- Shares, for hold and covered-call research
- Index markets, for trend and allocation context
- Commodities, where a hedge has to name the contract
- Listed contracts, expiry and collateral
- Listed options, strikes and contract size
- Currency markets, a separate question from hedging a foreign holding
- What each asset class is
- Costs and the firm on the contract
- Drawdown, liquidity and the loss you can take
How this section is written
Facts that need a source are tied to one. A calculator result stays inside the tool, with the assumption on that page. Commercial relationships do not order these notes. A comparison that still lacks a confirmed fee is not rewritten here as a finding. The methodology and the commercial disclosure are the longer versions of those rules.
MethodologyEditorial policyCommercial disclosureCorrections
Sources and review
Written by: WiT Markets Editorial. Writes and structures WiT Markets pages. Separates a sourced fact from a cell that is Not confirmed.
Review: Editorially reviewed. This is not a qualified specialist review and it is not a legal sign-off.
Last reviewed: . Next review due . The date is an editorial pass. It is not a live check of every third-party fee.
Regulatory and official sources
- Investor.gov — checked 13 October 2026
Other sources
- WiT Markets methodology — checked 13 October 2026
- Options Clearing Corporation — checked 13 October 2026
Methodology. Editorial policy. Corrections. Report an error.