Research
A drawdown is the climb back, not only the fall
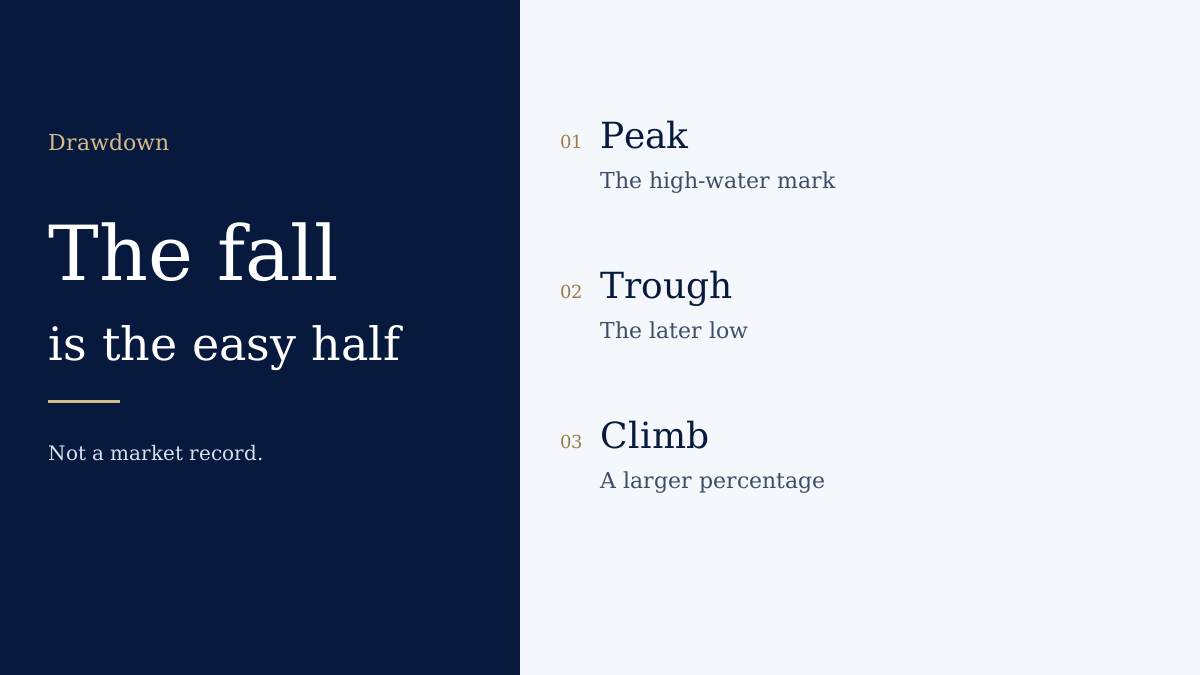
A drawdown is the fall from a previous peak to a later trough. The percentage gain required to return to that peak is larger than the percentage lost. The arithmetic is the point of the note.
Key points
- Recovery required is the previous peak divided by the trough, minus one.
- A 50 percent fall needs a 100 percent gain to get back to the same peak.
- A journal’s cumulative profit-and-loss drawdown is not a drawdown of account equity.
What is going on
Take a portfolio that peaks at 100 and falls to 50. The monetary drawdown is 50. The percentage drawdown is 50 percent of the peak. Getting back to 100 from 50 is a doubling, which is a 100 percent gain on the trough. The formula is the peak divided by the current value, minus one. It is undefined when the current value is zero or negative, because there is no finite percentage that restores a wiped-out balance.
Why it matters
Volatility is the scatter of returns. A drawdown is a path. A strategy can have a modest average scatter and still spend a long time below a peak. Leverage shortens the path to a large drawdown because losses are applied to a bigger exposure than the cash posted. Concentration does the same when one holding is the portfolio. Neither observation is a forecast of the next decline.
What to watch
Name the series. A price index, a total-return index, a funded account and a list of closed trades are different. The trading journal on this site can show a drawdown of cumulative results. It does not know deposits, withdrawals or open risk, so it will not pretend that figure is a percentage return on capital. The drawdown calculator will take a peak and a current value that you type.
Risks
Past peak-to-trough paths do not bound the next one. A stop-loss order is not a guarantee that the loss stops at the typed level. Liquidity, gaps and the failure of a firm can all produce a worse result than the worksheet.
Recovery mathematics
The fall is the peak minus the trough, divided by the peak. The climb is the peak divided by the trough, minus one. From 100 to 80 the fall is 20 percent and the climb is 25 percent. From 100 to 50 the climb is 100 percent. From 100 to 25 the climb is 300 percent. At zero the climb is not a finite percentage. The recovery table on the risk hub is this identity at 10, 20, 30, 40, 50, 60 and 75 percent. It is not a market history.
Depth, time and compounding
Depth is how far below the peak the series went. Time underwater is how long it stayed there. They are different facts. A contribution during the fall buys more units. A withdrawal during the fall locks in the smaller base. Compounding after the loss starts from what remains, so the same annual gain replaces a deep hole more slowly than a shallow one. A later return you type into the lab is the return you typed. It is not a forecast that the recovery arrives.
Related
Sources and review
Written by: WiT Markets Editorial. Writes and structures WiT Markets pages. Separates a sourced fact from a cell that is Not confirmed.
Review: Editorially reviewed. This is not a qualified specialist review and it is not a legal sign-off.
Last reviewed: . Next review due . The date is an editorial pass. It is not a live check of every third-party fee.
Regulatory and official sources
- Investor.gov — checked 13 October 2026
Other sources
- WiT Markets methodology — checked 13 October 2026
Methodology. Editorial policy. Corrections. Report an error.