Research
Volatility and a drawdown measure different things
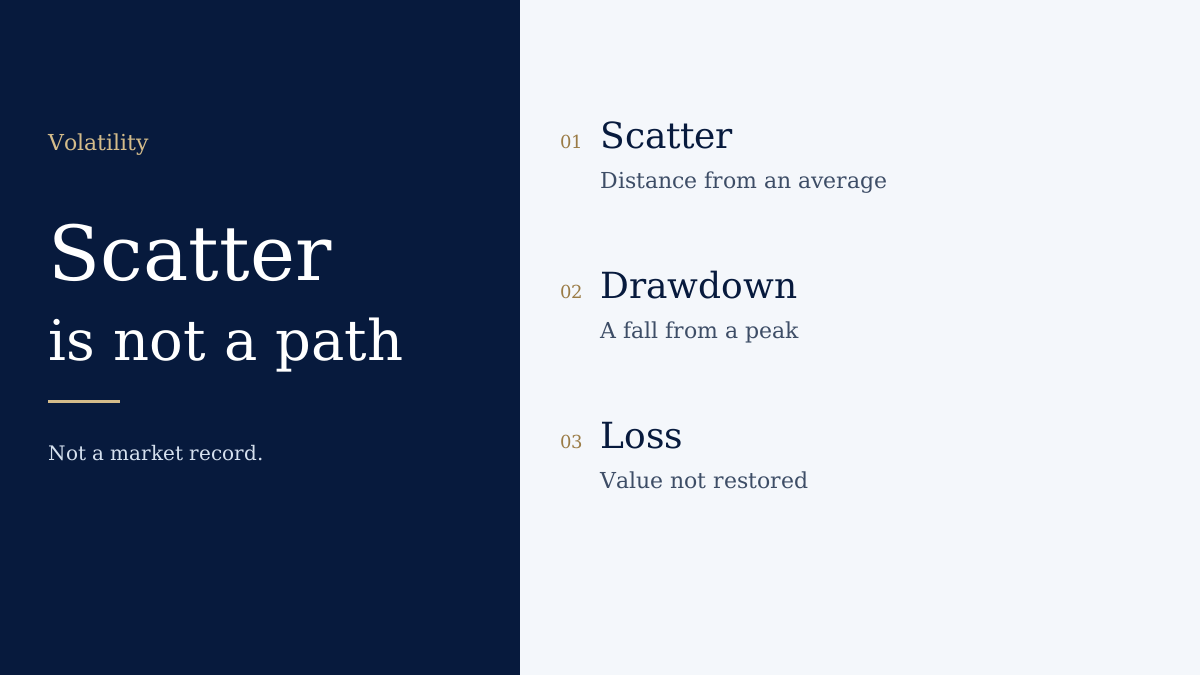
Volatility is dispersion around a reference. A drawdown is a decline from a high-water mark. A permanent loss is value that is not restored. Liquidity is whether you can trade the size. One number does not stand in for the other four.
Key points
- Two paths can end near the same place and spend very different times below a peak.
- A calm historical scatter does not bound the next gap.
- Any path drawn on this hub as an illustration is synthetic. It is not a market history.
What is going on
A standard deviation summarises how far a set of returns sat from their average. It does not say whether those returns arrived as a slow grind or as one gap. A drawdown needs a peak and a later trough on a named series. Investor.gov materials on risk describe the chance of losing money and the role of diversification. They do not publish a single risk score, and this desk does not add one.
Why it matters
A position can be volatile and still finish above its start. It can also fall a long way from a peak while the long-run scatter looks ordinary, because the scatter was measured on a different window. Treating a low historical volatility as a small possible loss mixes the two. Fat tails are the returns that sit further out than a bell curve fitted to the middle would suggest. This note does not fit a distribution to a price history.
What to watch
Name the series, the window, and whether you are talking about scatter, a peak-to-trough path, or the price you can actually trade. If a chart on this site is labelled synthetic, read it as arithmetic, not as a backtest.
Risks
A simple normal curve is a poor description of extreme market losses. This page does not estimate a value-at-risk figure, because that would need a horizon, a method and a dataset this hub does not run.
What a matching end point hides
Two hypothetical paths can be drawn to finish at the same value. One dips early and recovers. The other falls later and deeper. Their scatters can be set to look similar while the drawdowns differ. The drawing is a teaching device. It is not a claim about any index.
Related
Sources and review
Written by: WiT Markets Editorial. Writes and structures WiT Markets pages. Separates a sourced fact from a cell that is Not confirmed.
Review: Editorially reviewed. This is not a qualified specialist review and it is not a legal sign-off.
Last reviewed: . Next review due . The date is an editorial pass. It is not a live check of every third-party fee.
Regulatory and official sources
- Investor.gov — checked 13 October 2026
Other sources
- WiT Markets methodology — checked 13 October 2026
Methodology. Editorial policy. Corrections. Report an error.